What you’ll learn
- Locate the stages and account for carbon per glucose.
- Explain proton pumping, oxygen reduction and ATP synthesis.
- Distinguish ATP investment, substrate-level phosphorylation and anaerobic NAD regeneration.
Connections: AQA 3.5.2 · OCR A 5.2.2. The standard eukaryotic glucose pathway and selected anaerobic and practical connections. Total ATP yields are condition-dependent; detailed carrier complexes and all alternative substrates are not covered here.
In this chapter
Glycolysis
Glycolysis occurs in the cytosol, the fluid part of the cytoplasm. ATP is used in forming hexose bisphosphate from glucose; splitting then gives two three-carbon triose phosphate molecules. Subsequent oxidation reduces NAD, and substrate-level phosphorylation forms ATP by transfer of phosphate from an intermediate to ADP. For each glucose molecule in this pathway, two ATP are invested and four are formed, giving a net gain of two ATP and two reduced NAD.
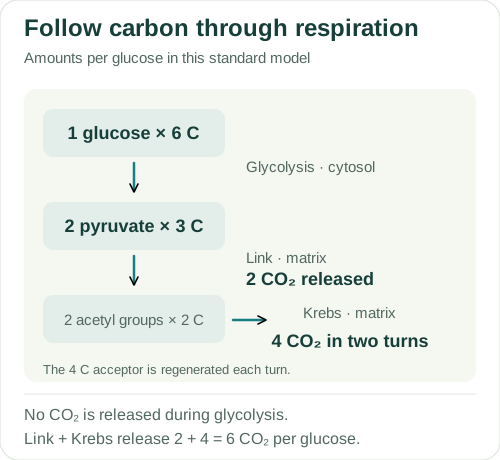
Two three-carbon pyruvate molecules are formed. No CO₂ is released during glycolysis, and oxygen is not a direct reactant in its steps. In the first part of glycolysis, ATP donates phosphate to a sugar. Later, a phosphorylated intermediate donates phosphate to ADP, making ATP. Both are phosphorylation reactions; check which molecule receives the phosphate.
The link reaction and Krebs cycle
In the mitochondrial matrix, each pyruvate loses carbon dioxide and is oxidised, reducing NAD. Its two-carbon acetyl group combines with coenzyme A. Per glucose, the two link reactions produce two acetyl-CoA, two CO₂ and two reduced NAD. The link reaction does not directly form ATP.
Each acetyl group enters the Krebs cycle by combining with the four-carbon acceptor oxaloacetate to form six-carbon citrate. Through subsequent reactions, oxaloacetate is regenerated, two CO₂ are released and coenzymes are reduced. Per glucose, two turns give six reduced NAD, two reduced FAD and two ATP equivalents through substrate-level phosphorylation. The carbon diagram gives net accounting: individual incoming acetyl carbons need not be released during their first turn.
About this diagram
Carbon-count accounting, not atom tracing. Individual acetyl carbon atoms need not leave during their first Krebs-cycle turn. Coenzymes, ATP, CoA and intermediates are explained in the text rather than drawn.
Oxidative phosphorylation
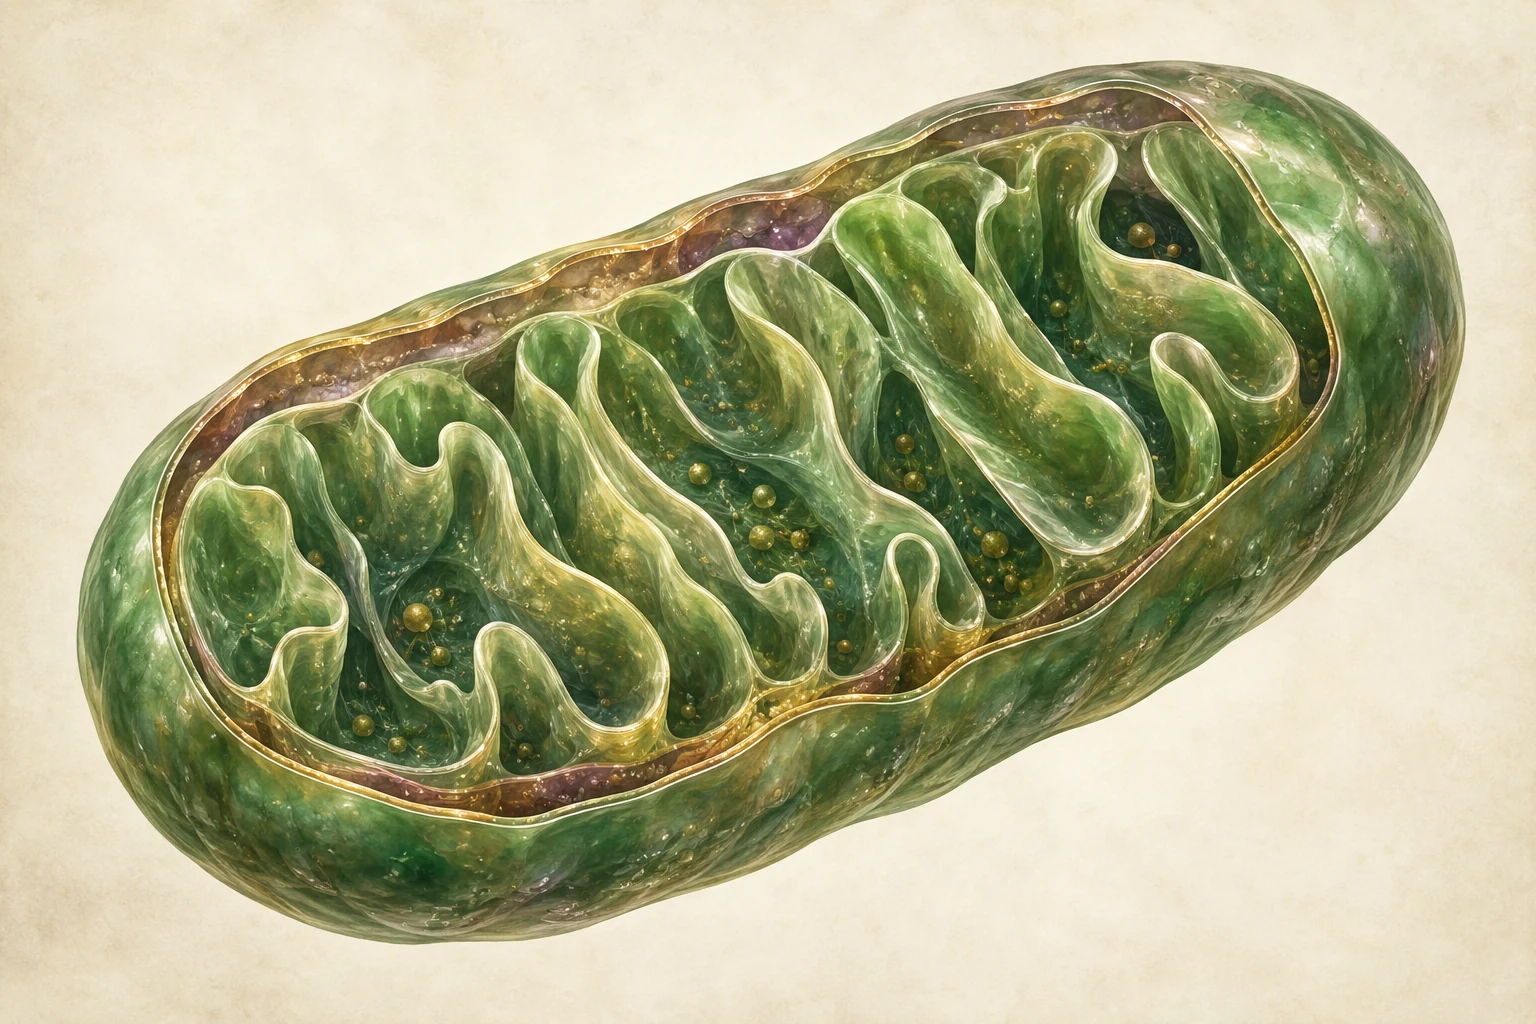
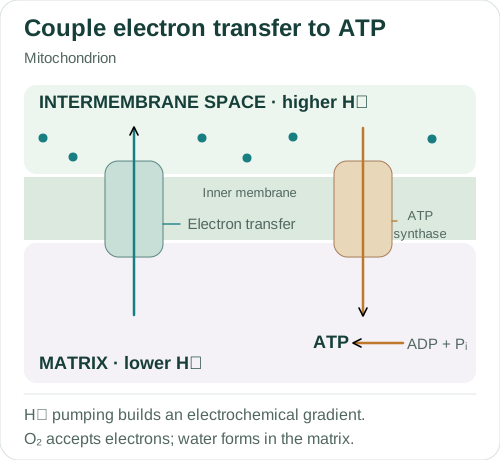
Reduced NAD and reduced FAD transfer electrons to the respiratory electron-transfer system. Electron transfer is coupled to proton pumping from the matrix into the intermembrane space across the inner mitochondrial membrane. The gradient stores potential energy. Cristae increase the membrane area available for the associated proteins.
Protons return to the matrix through ATP synthase, which couples this favourable flow to ATP production from ADP and inorganic phosphate. Oxygen is the terminal electron acceptor and combines with electrons and protons to form water. If oxygen is unavailable, electron transfer stalls and reduced coenzymes cannot be reoxidised at the required rate. This indirectly restricts other stages that need oxidised coenzymes.
About this diagram
Selected coupling mechanism only. NADH and FADH₂ entry points, individual respiratory complexes and electron-transfer arrows are not drawn. The oxygen note describes terminal reduction rather than proton flow.
Lactate and ethanol fermentation
In mammalian anaerobic metabolism, pyruvate is reduced to lactate using reduced NAD, regenerating oxidised NAD. Yeast can convert pyruvate to ethanal with release of CO₂, then reduce ethanal to ethanol while regenerating NAD. These reactions allow continued glycolysis but do not provide the large oxidative-phosphorylation yield.
In these lactate and ethanol pathways, the net ATP comes from glycolysis: two ATP per glucose. The lactate-forming step itself does not add another ATP gain. Other microorganisms can use different pathways without oxygen. The two-ATP total here applies to the mammalian and yeast examples described.
Measuring respiration and RQ
A respirometer can estimate oxygen uptake when carbon dioxide is absorbed and pressure or volume changes are interpreted appropriately. A matched control helps account for temperature- or pressure-related changes. Compare rates per unit mass when appropriate, and specify time units. A movement of a fluid marker needs the tube geometry or a supplied calibration to become a gas volume.
Respiratory quotient is CO₂ produced divided by O₂ consumed, using comparable molar amounts or gas volumes measured under comparable conditions. An RQ near 1 is consistent with carbohydrate oxidation in the simple model; values near 0.7 are associated with fat oxidation. Mixtures and other processes complicate interpretation. ATP yield also depends on the calculation’s assumptions. Use the values supplied for each reduced coenzyme; actual yields vary between cells and conditions.
Worked examples
1. Complete a coenzyme ledger
For complete glucose oxidation in the standard pathway, combine glycolysis, link and two Krebs turns.
- Reduced NAD: 2 + 2 + 6 = 10 per glucose.
- Reduced FAD: 0 + 0 + 2 = 2 per glucose.
- Net substrate-level ATP equivalents: 2 + 0 + 2 = 4.
The ledger gives 10 reduced NAD, 2 reduced FAD and 4 net ATP equivalents before counting oxidative-phosphorylation output.
“Per turn” and “per glucose” are different reference groups. Two pyruvate and two acetyl groups arise from one glucose.
2. Use supplied ATP assumptions
A question assumes 2.5 ATP per reduced NAD and 1.5 ATP per reduced FAD, with all ten NAD entries credited at that rate. Use the ledger’s four ATP equivalents.
- NAD contribution = 10 × 2.5 = 25.
- FAD contribution = 2 × 1.5 = 3.
- Add net substrate-level contribution: 25 + 3 + 4.
Under these supplied assumptions, the total is 32 ATP equivalents per glucose.
The stated coenzyme yields give 32 ATP equivalents. Different shuttle systems, coupling efficiencies and cellular costs can change the total in an actual cell.
3. Calculate and interpret RQ
Over the same interval and at comparable gas conditions, a sample produces 0.60 cm³ CO₂ and consumes 0.75 cm³ O₂. Calculate RQ.
- RQ = CO₂ produced ÷ O₂ consumed.
- 0.60 ÷ 0.75 = 0.80.
RQ is 0.80 and has no units.
The result may be consistent with a mixture of respiratory substrates. It does not prove that one named substrate is being used exclusively.
These are original teaching examples, not reproduced exam questions or an official mark scheme.
Common errors
Oxygen is used directly in glycolysis.
Its terminal electron-acceptor role is in the electron-transfer system.
The link reaction directly produces ATP.
It produces acetyl-CoA, CO₂ and reduced NAD in the standard account.
Making lactate provides the extra ATP.
Lactate formation regenerates NAD; the ATP gain comes from glycolysis.
Protons return from matrix to intermembrane space through ATP synthase.
Their favourable return is to the matrix from the intermembrane space.
Check your understanding
Try the questions before opening the answers.
1. Why does glycolysis need a route to regenerate oxidised NAD?
NAD accepts reducing equivalents during oxidation of glycolytic intermediates. Without regeneration, the available oxidised NAD pool becomes limiting.
2. Where are ATP synthase and the proton gradient located?
ATP synthase spans the inner mitochondrial membrane. The gradient is across that membrane between intermembrane space and matrix.
3. Why is the oxygen-uptake control useful?
A comparable control can reveal marker movement caused by temperature or pressure changes rather than respiration by the sample. It must match the relevant non-biological conditions.
Practice for this topic
- Respiration measurements and RQ
- Rates and graph gradients
- Averages, spread and mitotic index
- Workbench: Respiration: correct a displacement measurement
- Apply to a case: Respiration: apparatus, controls and interpretation
- Practical guide: Respiration practical data
Connect this topic to an AQA essay title · Use official papers and mark schemes
Glossary
- Reduced NAD
- NADH; an electron-carrying coenzyme in the respiratory account.
- Substrate-level phosphorylation
- Direct phosphate transfer from a metabolic intermediate to ADP.
- Oxidative phosphorylation
- ATP production coupled to electron transfer and a proton gradient.
References
References used for the explanations and diagrams, checked on 4 October 2026. The diagrams are schematics and are not to scale. Open “About this diagram” for the assumptions and details left out.