What you’ll learn
- Explain induced fit and a reduced activation barrier.
- Connect temperature, pH and concentrations to initial rate.
- Interpret inhibition using the stated model and experimental evidence.
Connections: AQA 3.1.4 · OCR A 2.1.4. Protein-enzyme catalysis and selected rate and inhibition models. OCR also requires cofactors, coenzymes, Q₁₀ and end-product inhibition; the connections here introduce these without covering every application.
In this chapter
The active site and induced fit
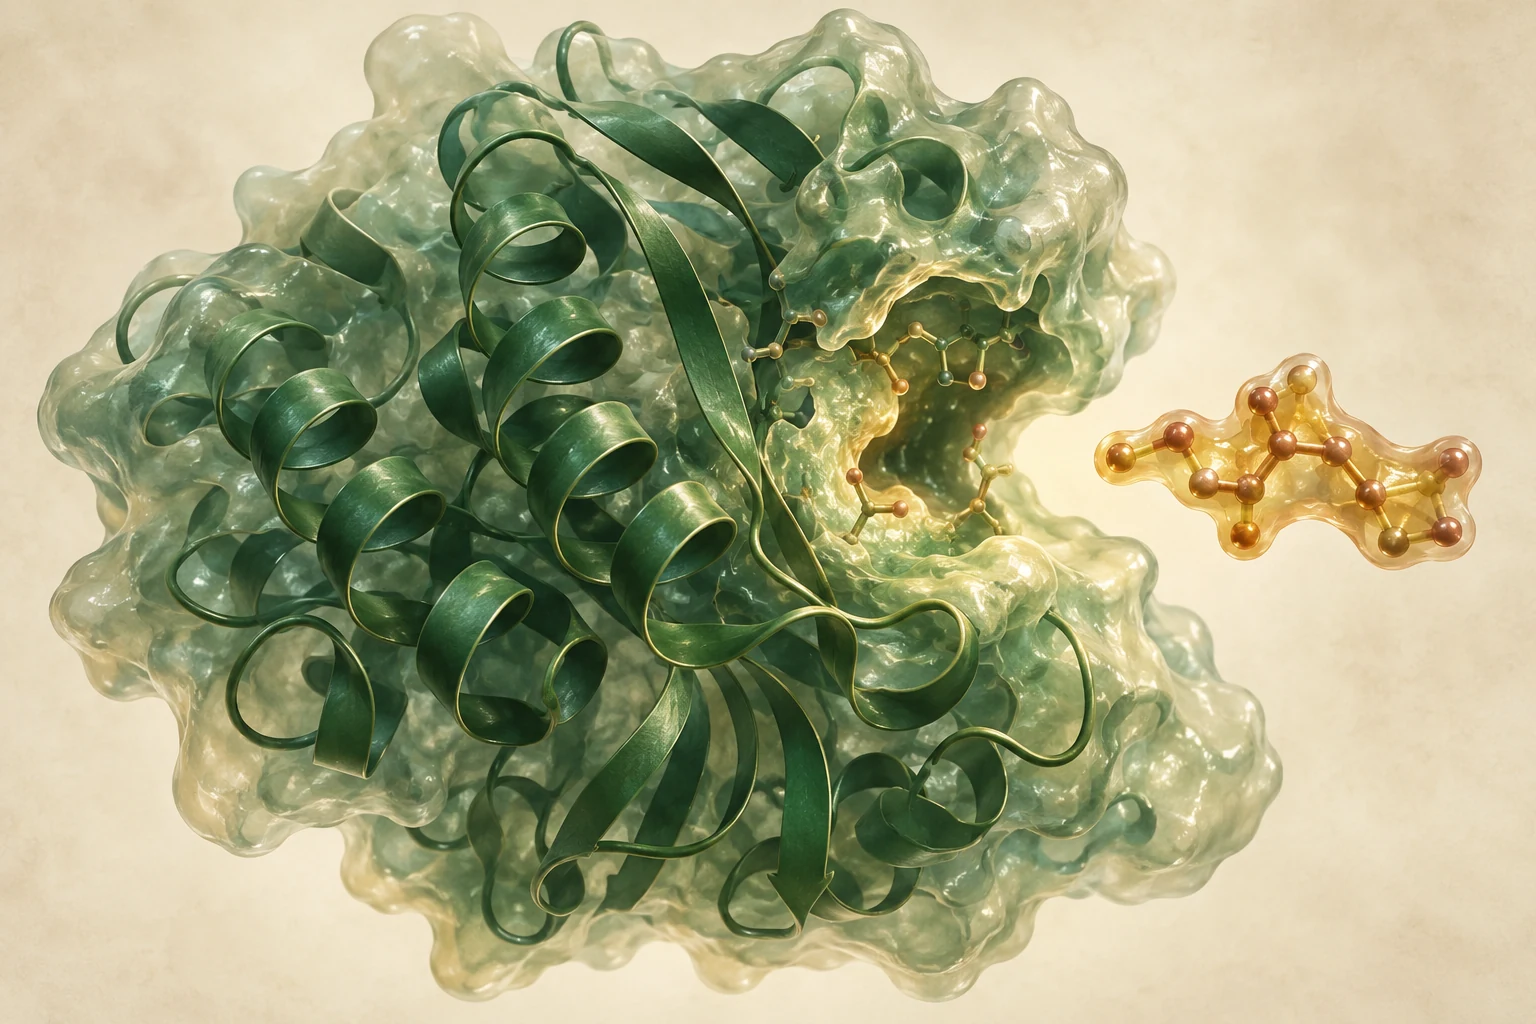
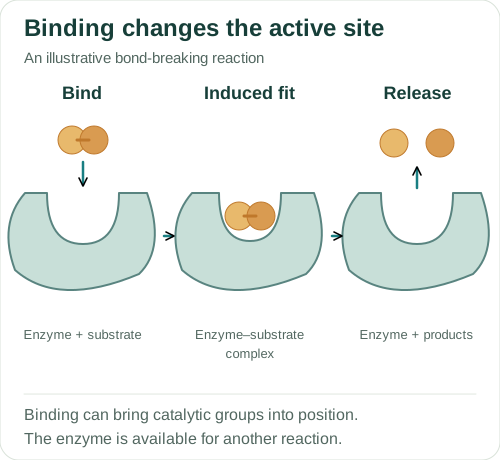
The active site is a region of a protein enzyme whose shape and chemical properties allow interaction with suitable substrates. Its arrangement depends on folding and the interactions maintaining tertiary structure. Binding forms an enzyme–substrate complex. In the induced-fit model, binding changes the enzyme’s conformation, helping position catalytic groups and the substrate for reaction.
The enzyme is released in a form available for another catalytic cycle. It does not supply the atoms that permanently become part of the product. Some enzymes join substrates; others break a substrate into products or rearrange groups. The diagram shows one cleavage example. The shapes stand for parts of the substrate; they do not show its molecular structure.
About this diagram
Schematic induced fit; molecule shapes represent groups, not chemical structures. Only one simple cleavage example is shown. The enzyme returns to an available conformation after release.
Activation energy
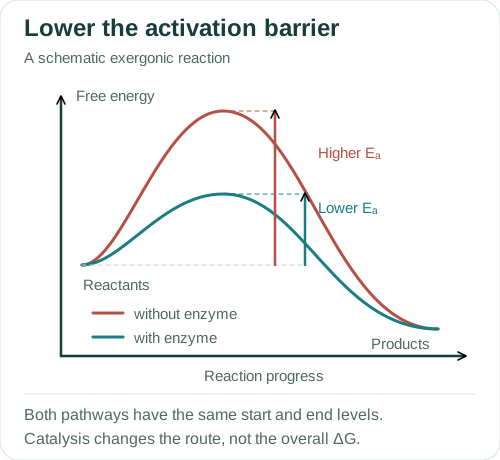
Activation energy is the barrier between reactants and the transition state along a reaction pathway. An enzyme provides a pathway with a lower barrier, increasing the rate at which reaction can occur under the same conditions. It does not change the overall free-energy difference between the reactants and products or the position of equilibrium.
The energy-profile diagram represents one exergonic reaction: the products have a lower free-energy level than the reactants. Both curves begin and end at the same levels. The different heights show different activation barriers. The horizontal axis follows the reaction pathway. It does not show elapsed time.
About this diagram
Schematic free-energy profile for one exergonic reaction. No numerical free-energy scale, kinetics or enzyme concentration is implied.
Temperature, pH and concentration
Increasing temperature usually increases molecular motion and successful enzyme–substrate encounters within a suitable range. At sufficiently high temperatures, changes to protein structure can disrupt the active site and reduce activity. Cooling within the usual experimental range slows the reaction without causing the high-temperature loss of folding described here. A low rate on its own does not prove denaturation.
A change in pH can alter ionisation of amino-acid side groups and interactions involved in binding or catalysis. Enzymes therefore have different suitable pH ranges. Increasing substrate concentration increases initial rate until available enzyme becomes saturated. Increasing enzyme concentration raises the potential rate only when substrate and other conditions do not impose a new limitation.
Some enzymes require non-protein helpers: these include inorganic cofactors, such as chloride ions for amylase, and organic coenzymes, many derived from vitamins.
Competitive and non-competitive inhibition
A reversible competitive inhibitor competes with substrate for binding at the active site. In the simple model, increasing substrate concentration can reduce its effect, and the same maximum rate can be approached. A pure non-competitive inhibitor reduces catalytic activity through binding at a different site; adding substrate does not restore the original maximum rate in that model.
Real inhibition patterns include mixed and irreversible effects, so an unfamiliar inhibitor should be interpreted from the evidence given. Binding away from an active site does not automatically prove every property of pure non-competitive inhibition. End-product inhibition is feedback in which a product of a metabolic pathway reduces activity at an earlier stage, helping regulate flux through that pathway. An allosteric site is not a second active site.
Measuring initial rate
A product–time curve often becomes shallower as substrate is depleted or products accumulate. To estimate initial rate, use the gradient of a tangent near the start, not the average gradient across the whole experiment. Take a large triangle on that tangent and calculate change in product divided by change in time. Preserve the units shown on both axes.
A fair comparison keeps enzyme concentration, substrate concentration, pH, temperature and timing consistent except for the independent variable. Repeat measurements help assess variability. A colorimeter measures absorbance, not enzyme activity directly: explain how the measured substance and its absorbance relate to product formation or substrate loss in that particular assay.
Worked examples
1. Calculate an initial rate
A tangent to a product–time curve passes through (0 s, 0.10 mmol) and (40 s, 0.90 mmol). Estimate initial rate.
- Change in product = 0.90 − 0.10 = 0.80 mmol.
- Change in time = 40 − 0 = 40 s.
- Gradient = 0.80 ÷ 40 = 0.020 mmol s⁻¹.
The estimated initial rate is 0.020 mmol s⁻¹.
The intercept is not zero, so subtract both y-values. Points used for the gradient must lie on the tangent, not be picked from a later curved part of the trace.
2. Use the OCR Q₁₀ relationship
Initial rates are 0.12 units min⁻¹ at 20°C and 0.24 units min⁻¹ at 30°C. Find Q₁₀ for this interval.
- The temperatures differ by exactly 10°C.
- Q₁₀ = rate at higher temperature ÷ rate at lower temperature.
- 0.24 ÷ 0.12 = 2.0.
Q₁₀ is 2.0: the rate doubled across this 10°C interval.
Q₁₀ compares rates separated by 10 °C. For a different interval, the temperature difference must be included in the exponential correction. The result applies to the interval measured.
3. Interpret a stated inhibition model
In a controlled experiment, inhibitor X lowers the maximum rate even when substrate is abundant. The question specifies the pure non-competitive model. Explain the result.
- X binds at a site other than the active site in the stated model.
- Its effect reduces the enzyme’s effective catalytic activity.
- More substrate cannot restore the original maximum rate.
Under the stated model, X reduces catalytic activity through non-competitive inhibition, so the limiting maximum rate remains lower at high substrate concentration.
The model is supplied here. Without it, a lower maximum alone would not exclude enzyme loss, irreversible inhibition or other explanations.
These are original teaching examples, not reproduced exam questions or an official mark scheme.
Common errors
Enzymes give substrates energy.
They lower the activation barrier by providing a different catalytic pathway.
Any low activity proves denaturation.
Low temperature, unsuitable pH, inhibitors or low substrate can also reduce rate.
The active site has exactly the same shape as its substrate.
Describe complementary interactions and the conformational change in induced fit.
The whole-curve gradient is always the initial rate.
Initial rate uses the early tangent or a justified initial linear interval.
Check your understanding
Try the questions before opening the answers.
1. Why can substrate concentration stop affecting rate at high values?
Available enzyme is saturated; catalytic cycling and enzyme amount become limiting. More substrate cannot create additional active enzyme.
2. Does an enzyme change the overall free-energy difference of a reaction?
No. Reactant and product free-energy levels are unchanged. The catalysed pathway has a lower activation barrier.
3. Why should the units of a colorimeter-based rate be stated carefully?
A change in absorbance per time is not automatically a concentration change per time. Conversion requires a relevant calibration or supplied relationship.
Practice for this topic
- Rates and graph gradients
- Averages, spread and mitotic index
- Measurement uncertainty
- Workbench: Enzymes: plan a pH comparison
- Apply to a case: Enzymes: rates, plateaus and conclusions
- Practical guide: Enzyme practical data
Connect this topic to an AQA essay title · Use official papers and mark schemes
Glossary
- Active site
- Enzyme region involved in substrate binding and catalysis.
- Initial rate
- Rate measured or estimated near the beginning of a reaction.
- Allosteric site
- A regulatory binding site distinct from the active site.
References
References used for the explanations and diagrams, checked on 4 October 2026. The diagrams are schematics and are not to scale. Open “About this diagram” for the assumptions and details left out.