What you’ll learn
- Connect the bilayer and membrane proteins to selective permeability.
- Explain net movement using concentration or water potential.
- Distinguish ATP-driven pumping from facilitated diffusion and co-transport.
Connections: AQA 3.2.3 · OCR A 2.1.5. Selected shared transport mechanisms, with AQA ileum co-transport and OCR vesicle-transport connections. Detailed membrane signalling and every practical protocol are outside this chapter.
In this chapter
The phospholipid bilayer
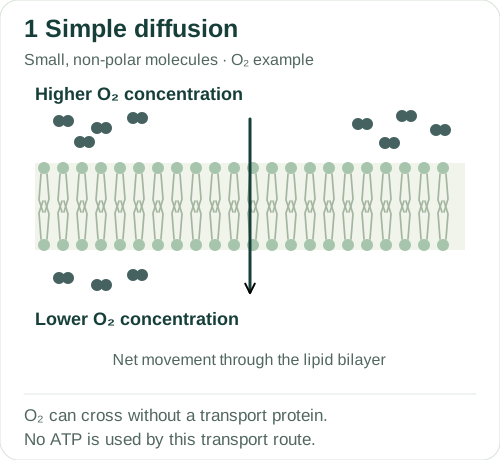
Phospholipids have hydrophilic heads and hydrophobic tails. In a bilayer, the heads face the aqueous regions and the tails face one another. The resulting interior limits passage of charged particles and many polar molecules. Small non-polar molecules such as oxygen can pass directly through the lipid part of the membrane.
The fluid-mosaic model also includes proteins and, in appropriate membranes, cholesterol, glycoproteins and glycolipids. Transport proteins provide selective routes; receptors participate in signalling, and surface molecules can be involved in recognition. Cholesterol influences membrane fluidity and permeability. Its effect varies with temperature and membrane composition.
Simple and facilitated diffusion
Particles move randomly in both directions across a route they can use. If more oxygen is present on one side of a permeable membrane, more molecules cross from that side per unit time, giving net movement down its concentration gradient. At equilibrium, molecules keep moving even though there is no net transfer.
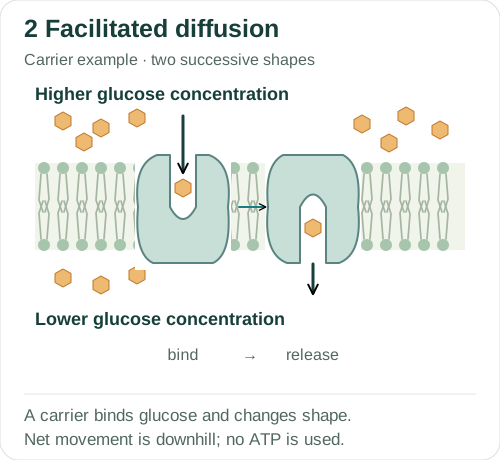
Facilitated diffusion uses channel or carrier proteins without ATP expenditure by the transport step. A carrier binds its substance and changes conformation, exposing the binding site alternately to the two sides. The illustrated glucose route is downhill. For ions, both concentration and electrical potential influence movement; together these form the electrochemical gradient.
About this diagram
Selected oxygen route through the lipid bilayer. The arrow shows net flux, not the motion of every molecule. Particle counts are illustrative, not measured concentrations.
About this diagram
Two successive carrier conformations, not two open pores or a permanent channel. The glucose route shown follows a favourable concentration gradient. Other membrane structures are omitted.
Active transport and co-transport
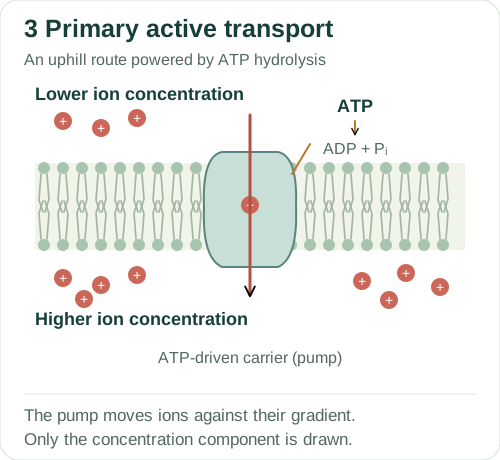
Primary active transport couples an energy-releasing reaction, such as ATP hydrolysis, to uphill transport. The pump can maintain an unequal ion distribution that would not persist through passive movement alone. The diagram shows the concentration gradient. For an ion, the voltage across the membrane also affects the energy needed to move it.
In the mammalian ileum, sodium ions enter an epithelial cell down their electrochemical gradient through a sodium–glucose co-transporter. This coupled movement can bring glucose into the cell against its concentration gradient. A sodium–potassium pump on the blood-facing membrane uses ATP to help maintain low intracellular sodium. Glucose can leave towards the blood through a facilitated-diffusion carrier when its concentration gradient favours that direction.
Endocytosis and exocytosis move material in membrane-bound vesicles. Endocytosis takes material into the cell; exocytosis releases it when a vesicle fuses with the cell-surface membrane. These processes require cellular energy. They are also required for OCR A.
About this diagram
A generic ATP-driven pump, not a full sodium–potassium pump cycle. Ion counts show only the concentration component; electrical potential and pump stoichiometry are not drawn.
Osmosis and water potential
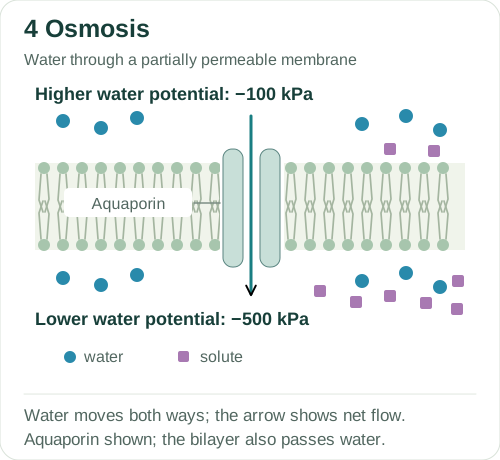
Osmosis is the net movement of water through a partially permeable membrane from higher to lower water potential. Adding dissolved solute lowers water potential at the same pressure. Pressure also contributes, so solute concentration alone cannot always give the direction of water movement. A value of −100 kPa is higher than −500 kPa.
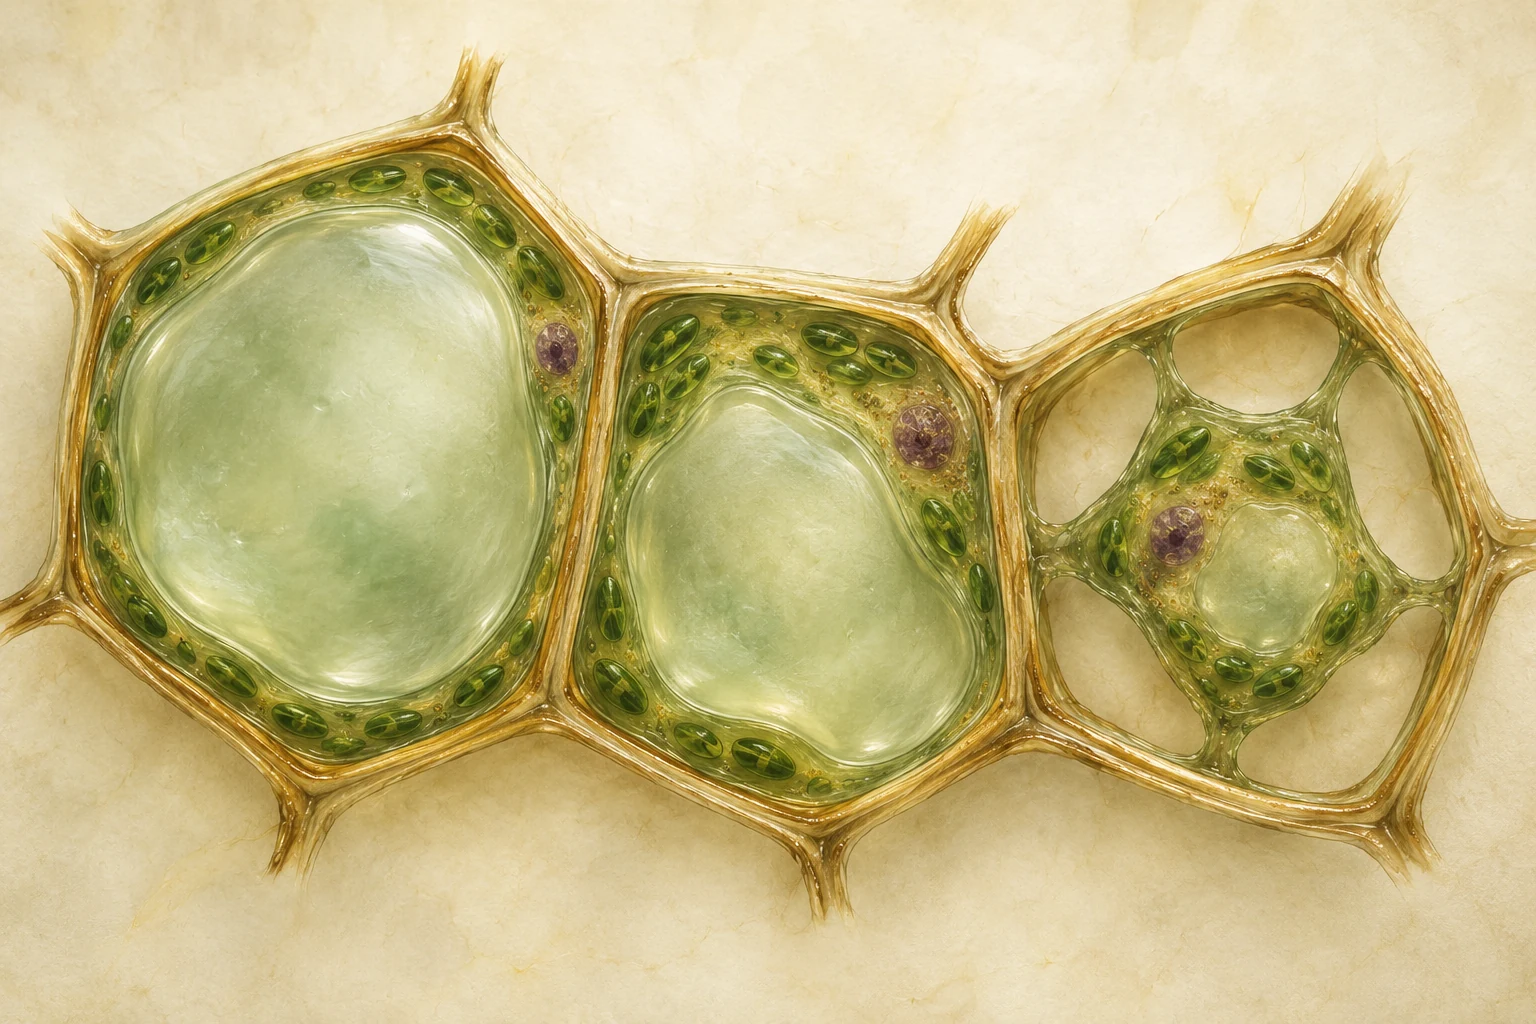
Water can cross through aquaporins and through the lipid bilayer. In a plant cell taking up water, the vacuole expands and the wall resists expansion, increasing pressure potential until net movement can cease. An animal cell lacks that wall and may lyse in sufficiently hypotonic conditions. Water loss from a plant cell can lead to plasmolysis when the membrane pulls away from the wall.
About this diagram
Aquaporin is one water route; the lipid bilayer can also pass water. Water potentials are supplied examples, not calculated from drawn particle counts. Solute is impermeant in this model; pressure effects are discussed in the chapter.
Investigating membrane transport
In an osmosis investigation, percentage mass change allows comparison between pieces with different starting masses, although similar size and surface area are still desirable. Blotting before weighing helps remove external solution. The solution concentration giving zero net mass change is an estimate of the tissue’s isotonic point under those conditions; it does not mean water molecules have stopped moving.
Beetroot pigment leakage indicates loss of membrane containment. Pigment starts in the vacuole and must cross its membrane as well as the cell-surface membrane to reach the surrounding solution. Keep tissue dimensions, exposure time and measuring conditions comparable.
Worked examples
1. Predict net water movement
A cell has water potential −400 kPa and its surrounding solution has water potential −150 kPa. The membrane passes water. Predict the initial net movement.
- Compare the complete water-potential values.
- −150 kPa is higher than −400 kPa.
- Net water movement is from the solution into the cell.
Water initially enters the cell by osmosis.
−150 kPa is higher than −400 kPa. Comparing the water-potential values gives the direction directly; the word “concentrated” is less precise because pressure can also affect water potential.
2. Calculate percentage mass change
A tissue piece changes from 2.40 g to 2.16 g. Calculate its percentage mass change.
- Change = 2.16 − 2.40 = −0.24 g.
- Percentage change = (−0.24 ÷ 2.40) × 100.
The mass change is −10.0%.
The negative sign reports loss of mass. Dividing by the final mass would answer a different question.
3. Explain an indirect ATP effect
An inhibitor reduces activity of the sodium–potassium pump in an intestinal epithelial cell. Explain why sodium–glucose co-transport may decline.
- The pump maintains the sodium gradient using ATP.
- Reduced pumping allows the driving sodium gradient to decrease.
- Less favourable sodium entry reduces the coupled uptake of glucose.
The inhibitor can reduce glucose absorption because the co-transporter relies on the sodium gradient maintained by ATP-dependent pumping.
ATP is used by the pump. The co-transporter uses the sodium gradient that the pump maintains, so reduced pumping can affect glucose uptake indirectly.
These are original teaching examples, not reproduced exam questions or an official mark scheme.
Common errors
A membrane protein means active transport.
Channels and carriers also mediate passive facilitated diffusion.
Water moves towards higher water potential.
Net osmosis is from higher to lower water potential.
No mass change means no water movement.
Opposing movements can balance, giving no net change.
Beetroot leakage tests only the cell-surface membrane.
Pigment must also escape the vacuole across the tonoplast.
Check your understanding
Try the questions before opening the answers.
1. Why can adding more glucose fail to keep increasing carrier-mediated uptake?
A finite number of carriers can become saturated. At that point, the availability and cycling rate of carriers constrain transport.
2. What enables a plant cell to become turgid without immediately lysing?
The cell wall resists expansion. Pressure potential rises as water enters, reducing the overall water-potential difference.
3. Which comparison distinguishes co-transport from simple diffusion?
Co-transport couples movement of two substances through a protein. The favourable gradient of one can drive uphill movement of the other.
Practice for this topic
- Units and standard form
- Surface area to volume ratio
- Dilutions and solution concentrations
- Workbench: Osmosis: compare tissue and solution
- Workbench: Membranes: evaluate a pigment-leakage comparison
- Apply to a case: Osmosis: from mass change to evidence
- Practical guide: Osmosis and water potential data
- Practical guide: Membrane permeability practical data
Connect this topic to an AQA essay title · Use official papers and mark schemes
Glossary
- Electrochemical gradient
- Combined effect of concentration and electrical potential on a charged substance.
- Water potential
- A measure of water’s potential energy relative to a reference state; gradients determine net osmosis.
- Tonoplast
- Membrane around a plant-cell vacuole.
References
References used for the explanations and diagrams, checked on 4 October 2026. The diagrams are schematics and are not to scale. Open “About this diagram” for the assumptions and details left out.