What you’ll learn
- Explain a structure–function link without confusing organelles.
- Distinguish magnification from resolution.
- Calculate actual size using magnification or a scale bar.
Connections: AQA 3.2.1 · OCR A 2.1.1. Core cell structures and microscopy calculations. This chapter does not cover all cell-fractionation methods, drawing conventions, viruses or cell division required by your course.
In this chapter
Cells and compartments
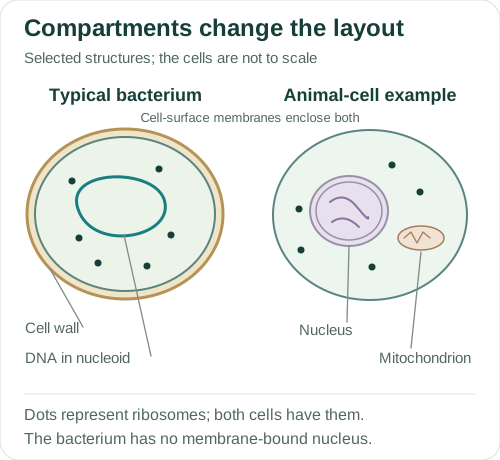
In a eukaryotic cell, membranes separate different chemical environments. The nuclear envelope surrounds the nuclear DNA; its pores regulate exchange with the cytoplasm. Mitochondria and chloroplasts also contain DNA. Ribosomes are sites of polypeptide synthesis and are not themselves membrane-bound organelles. A typical bacterium has no membrane-bound nucleus: its main chromosome lies in a region of cytoplasm called the nucleoid.
Both the bacterial and animal-cell examples in the diagram have a cell-surface membrane, cytoplasm, DNA and ribosomes. The bacterial wall is outside the membrane. Many bacteria also have plasmids, a capsule or flagella, but these are not features to assume in every image. The animal-cell diagram shows only a few structures; others have been left out to keep them clear.
About this diagram
Selected structures only. The bacterial drawing is a typical teaching example, not every bacterium or archaeon. Organelles and relative cell sizes are not to scale.
Organelles and their functions
Cells with a high ATP demand often contain many mitochondria. Aerobic respiration supplies ATP for activities such as active transport. Within each mitochondrion, cristae increase the inner-membrane area available for electron-transfer proteins and ATP synthase. The matrix contains enzymes involved in the link reaction and Krebs cycle.
Rough endoplasmic reticulum has bound ribosomes and helps process proteins entering the secretory pathway. Transport vesicles carry these proteins to the Golgi apparatus, where they can be modified and sorted. Secretory vesicles can fuse with the cell-surface membrane to release their contents. Ribosomes make the polypeptide; the Golgi does not translate the mRNA.
In a plant cell, the cellulose wall supports the cell and the large vacuole contributes to turgor.
| Structure | Useful structure–function link |
|---|---|
| Ribosome | Reads mRNA and supports polypeptide synthesis. |
| Lysosome | Contains hydrolytic enzymes for digestion of material. |
| Chloroplast | Thylakoid membranes support light-dependent reactions; the stroma supports the Calvin cycle. |
| Cell-surface membrane | Separates the cytoplasm from the surroundings and contains transport and signalling proteins. |
Magnification and resolution
Magnification is image size divided by actual size. It tells you how much larger the image is than the object. Resolution is the ability to distinguish close points as separate. Enlarging a blurred picture can increase magnification without revealing any new detail.
A transmission electron microscope can show internal ultrastructure in a thin section. A scanning electron microscope gives information about surface topography. A light microscope can be used to observe suitable living material, whereas conventional electron-microscope preparation is not compatible with living specimens. A section may miss part of an organelle, so the absence of a structure in one slice is weaker evidence than its clear presence.
Measuring cells and organelles
If magnification is supplied, convert image size and actual size into the same units before substituting. The magnification ratio has no units. For example, an image measured in millimetres cannot be divided by an actual length in micrometres until one value is converted. Use 1 mm = 1000 µm to convert between them.
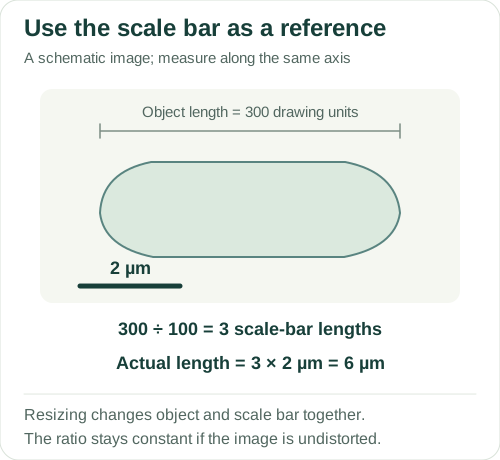
A scale bar is often safer for a resized digital image. Measure the object and scale bar along the same image axis, divide object length by scale-bar length, then multiply by the length represented by the bar. The two measurements can be in millimetres or pixels as long as they use the same unit. Uniform resizing changes both lengths together, preserving their ratio.
About this diagram
This is a calibrated schematic, not a light or electron micrograph. Drawing units are internal SVG coordinates, not millimetres on the reader’s screen.
What can a micrograph show?
A secretory cell may contain extensive rough ER and Golgi membranes, but an image alone does not measure secretion rate. Explain the expected relationship and describe what further measurement would test it. Likewise, seeing many mitochondria supports a suggestion about ATP demand; it does not establish the cell’s exact respiration rate.
In comparisons, use equivalent preparation and imaging conditions. Consider whether structures were counted per cell, per section or per unit area. A larger section can contain more visible organelles without the whole cell having a greater organelle density. Check what was counted before comparing the results.
Worked examples
1. Calculate actual size
A printed cell image is 54 mm long at ×5000 magnification. Find its actual length in µm.
- Convert 54 mm to 54 000 µm.
- Actual size = image size ÷ magnification.
- 54 000 ÷ 5000 = 10.8 µm.
The actual length is 10.8 µm.
Starting with the unit conversion prevents an answer that is a thousand times too large. The magnification is a ratio, so it does not add a unit to the result.
2. Calculate from a scale bar
A scale bar representing 2 µm measures 18 mm on a print. An organelle in the same print measures 63 mm.
- Object-to-bar ratio = 63 ÷ 18 = 3.5.
- Actual organelle length = 3.5 × 2 µm.
The actual length is 7 µm.
The print dimensions are used only to form a ratio. They do not imply that the organelle itself is measured in millimetres.
3. A cell that secretes a protein hormone
A cell exports large amounts of a protein hormone. Explain why extensive rough ER and Golgi membranes would be useful.
- Ribosomes on rough ER synthesise polypeptides entering the secretory pathway.
- Vesicles transfer the proteins to the Golgi for modification and sorting.
- Secretory vesicles fuse with the cell-surface membrane, releasing their contents by exocytosis.
Bound ribosomes produce polypeptides entering the secretory pathway. Rough ER supports their processing, and vesicles transfer them to the Golgi for modification and sorting before secretory vesicles release the hormone by exocytosis.
Extensive rough ER provides membrane area for many bound ribosomes and for protein processing. The Golgi then has to handle the proteins arriving from it, so more processing and sorting capacity is useful.
These are original teaching examples, not reproduced exam questions or an official mark scheme.
Common errors
A larger image always has better resolution.
Enlargement cannot recover detail that was not resolved.
The Golgi synthesises polypeptides.
Translation takes place at ribosomes; Golgi membranes modify and sort products.
All DNA in a eukaryote is nuclear.
Mitochondria and chloroplasts also contain DNA.
All bacteria have capsules and plasmids.
These are additional features of some bacteria.
Check your understanding
Try the questions before opening the answers.
1. A blurred micrograph is enlarged fourfold. What happens to the detail?
The image is larger, but the original resolution is unchanged. Previously unresolved structures remain unresolved.
2. Why should an image measurement and scale-bar measurement use the same unit?
Their ratio must compare like with like. A unit mismatch changes the numerical ratio without changing the object.
3. Why can one cell section underestimate mitochondrial number?
Some mitochondria lie outside that section. Section counts depend on the plane and thickness as well as whole-cell abundance.
Practice for this topic
- Magnification and image size
- Units and standard form
- Surface area to volume ratio
- Practical guide: Microscopy and mitotic index
Connect this topic to an AQA essay title · Use official papers and mark schemes
Glossary
- Resolution
- Ability to distinguish close points as separate.
- Magnification
- Image size divided by actual size.
- Nucleoid
- Region containing the main bacterial chromosome, without a nuclear envelope.
References
References used for the explanations and diagrams, checked on 4 October 2026. The diagrams are schematics and are not to scale. Open “About this diagram” for the assumptions and details left out.