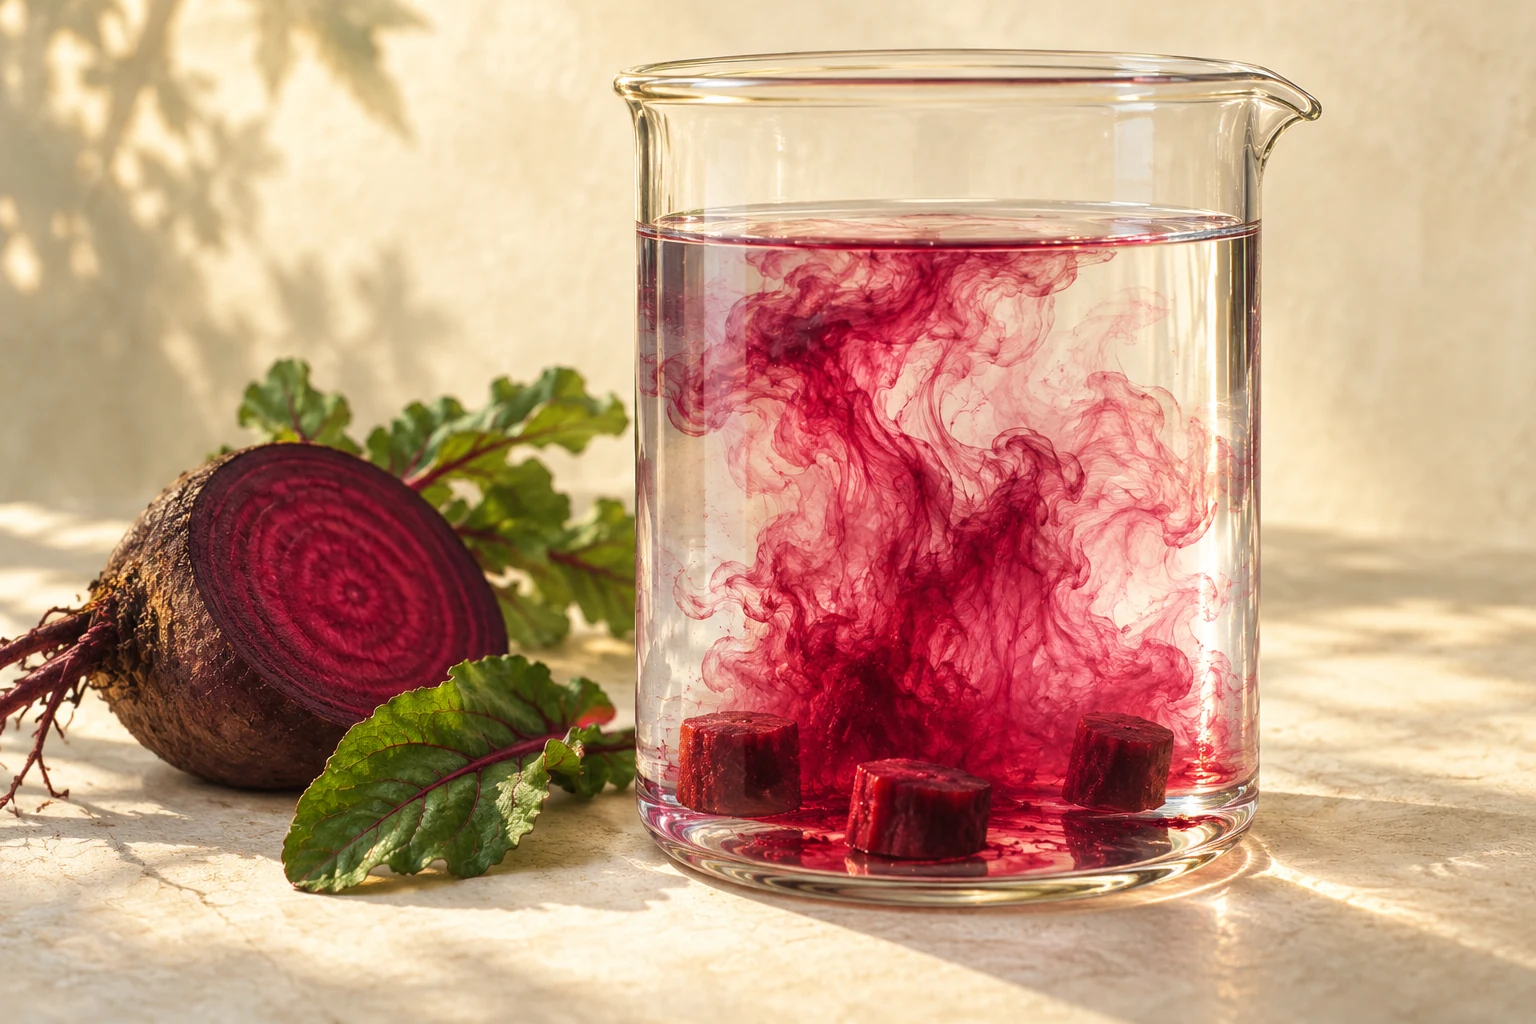
All design choices and example data
What should be varied?
- Select a different colorimeter wavelength for each treatment temperature. Absorbance depends on wavelength. Different settings make the readings unsuitable for direct comparison.
- Increase the mass of tissue as treatment temperature increases. More tissue can release more pigment independently of the temperature treatment.
- Vary treatment temperature between otherwise comparable tissue samples. Temperature is the intended independent variable. This is the suitable option for the stated question.
Which recording method supports the stated temperature comparison?
- Record how many tissue pieces show a visible colour change. This loses the amount of pigment released into the solution and depends on a subjective threshold.
- Record solution absorbance after the same 10 min treatment. Comparable instrument conditions and duration support a pigment comparison. This is the suitable option for the stated question.
- Record solution colour by eye under different lighting at each temperature. Changing illumination and judging colour by eye make the colour signal inconsistent. Use the same instrument settings and suitable blanking.
Which control approach is useful?
- Standardise tissue amount, cut surface, preparation and treatment duration. These factors affect leakage independently of the intended temperature comparison. This is the suitable option for the stated question.
- End each treatment when the solution reaches the same visible colour. An endpoint chosen from the result gives unequal exposure times. It does not compare absorbance after the stated 10 min.
- Rinse the pieces for cooler treatments, but leave pieces for hotter treatments unrinsed. Different preparation leaves different amounts of cutting-released pigment. That can covary with temperature and affect the signal.
Matched example
Comparable tissue amount and preparation are used.
Calculation questions and worked method
Calculate the mean absorbance at 40 °C.
Mean = (0.17 + 0.18 + 0.19) ÷ 3 = 0.18. Mean absorbance = 0.18; absorbance is dimensionless.
Calculate mean absorbance at 50 °C minus mean absorbance at 20 °C.
Absorbance difference = 0.4 − 0.06 = 0.34. This is not a permeability coefficient.
Tissue amount increases with temperature
The example uses increasingly large tissue samples. Its higher readings cannot be attributed only to temperature.
Calculation questions and worked method
Calculate the mean absorbance at 40 °C.
Mean = (0.29 + 0.3 + 0.31) ÷ 3 = 0.3. Mean absorbance = 0.3; absorbance is dimensionless.
Calculate mean absorbance at 50 °C minus mean absorbance at 20 °C.
Absorbance difference = 0.7 − 0.06 = 0.64. This is not a permeability coefficient.
Evaluation prompt
Explain why a larger absorbance at a higher temperature does not by itself identify a particular molecular membrane change. Evaluate the tissue-amount confound and propose a stronger comparison.
Example explanation and self-check points
A larger absorbance is consistent with more pigment in the sampled liquid under suitable measurement conditions. It is not a direct permeability coefficient and does not distinguish lipid changes from particular protein changes. Increasing tissue amount with temperature provides another reason for higher readings. Standardise tissue amount, cut surface, preparation, duration and instrument conditions; use separate pieces to assess variation. More repeats do not remove a systematic tissue-amount confound.
- I interpret absorbance as a pigment signal and limit the molecular claim.
- I explain how unequal tissue amount confounds the temperature comparison.
- I propose standardisation and distinguish repeat variation from a systematic confound.
Print matched-example questions · Print questions with answers
Original fixed datasets and reasoning tasks. Full requirements: AQA practical assessment · OCR A specification. These activities do not replace laboratory work or assessment of practical competence.