
What you’ll learn
- Account for producer and consumer production using consistent units.
- Distinguish the microbial processes in a selected nitrogen cycle.
- Evaluate sampling, population change and conservation using the evidence available.
Connections: AQA 3.5.3, 3.5.4, 3.7.4 · OCR A 4.2.1, 6.3.1, 6.3.2. Selected production, nitrogen-cycle and field-evidence concepts. Detailed carbon and phosphorus cycles, mycorrhizae, biodiversity indices, organism identification, interspecific interaction models and full conservation case studies need further study.
In this chapter
Gross and net primary production
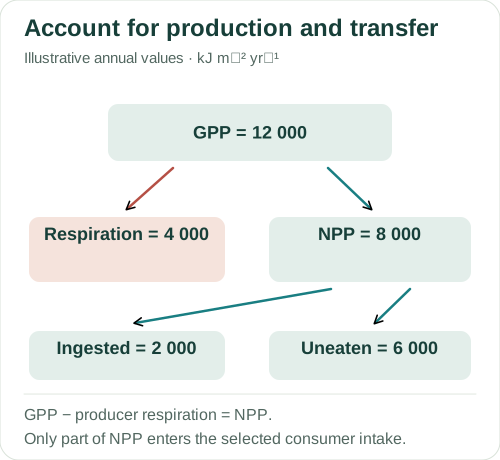
Producers build organic compounds using an energy input, commonly light in photosynthesis. Gross primary production (GPP) describes the production before producer respiratory losses are subtracted. Net primary production (NPP) is what remains: NPP = GPP − R. It is available for producer growth and reproduction and can enter herbivore and decomposer pathways.
Productivity expresses a rate. An annual energy budget might use kJ m⁻² yr⁻¹, fixing both area and time. Standing biomass, such as grams of dry tissue per square metre on a sampling date, is a stock measured at one time. It gives no production rate. A large standing biomass does not by itself reveal how rapidly new biomass is being made.
In the illustrative figure, GPP is 12 000 and producer respiration is 4 000, leaving NPP of 8 000 in shared annual energy units. Only 2 000 enters the selected consumers’ intake. The remaining 6 000 is not ingested by those consumers: it may remain in biomass or enter other pathways, including decomposition.
About this diagram
An illustrative producer-to-consumer account for one area and interval. Uneaten production can include retained biomass and material available to decomposers. Consumer egestion, respiration and production are worked separately in the chapter. Values are energy-flow quantities, not standing-biomass measurements.
Consumer production and transfer efficiency
In the AQA consumer budget, N = I − (F + R): net production is ingested energy minus the losses represented by faeces and urine and by respiration. State what each supplied quantity includes before calculating. A problem that defines F as faecal loss alone must account separately for any urinary loss if that loss is part of the budget.
Not all producer material is eaten, not all ingested material is assimilated, and some assimilated energy is used in respiration. Respiratory transfers eventually dissipate energy as heat. Net consumer production supports growth and reproduction and may become available to another consumer. Efficiency needs a named input and output, such as net consumer production divided by the preceding trophic level’s net production.
The familiar 10% transfer figure is an approximation used in some teaching models, not a universal constant. Organisms, food quality, conditions and the budget definition affect the estimate. An efficiency calculated from consumer intake has a different denominator from an efficiency calculated from producer NPP. Use the question’s reference quantities.
The nitrogen cycle
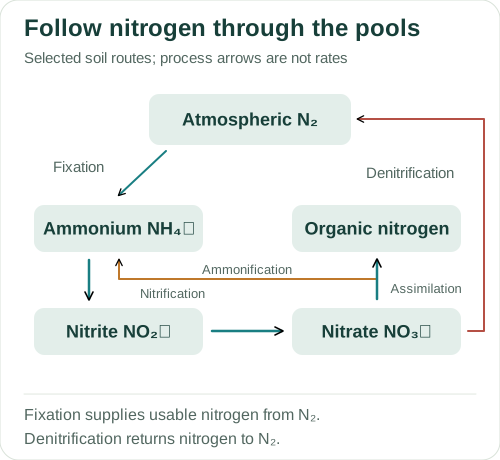
Atmospheric nitrogen is abundant, but most plants cannot use N₂ directly. Nitrogen-fixing microorganisms reduce N₂ to biologically usable nitrogen, represented here by ammonium. Some live freely; others, such as Rhizobium in legume root nodules, live in association with plants. Nitrogen-containing organic compounds are then built through assimilation of available inorganic nitrogen.
Decomposers break down organic material. Ammonification releases ammonium from organic nitrogen. Nitrifying microorganisms oxidise ammonium to nitrite and then nitrate, processes favoured by suitable oxygen availability. Nitrosomonas is a named example for ammonium oxidation, and Nitrobacter for nitrite oxidation. The diagram shows both steps.
Plants take up nitrate and can reduce and incorporate its nitrogen into compounds such as amino acids. Denitrifying microorganisms can reduce nitrate towards nitrogen gases under oxygen-poor conditions, returning nitrogen to the atmosphere. Fixation and denitrification therefore have opposite net directions with respect to atmospheric N₂.
Fertiliser can replace nitrogen removed by harvesting, but leaching carries soluble nutrients away. In an aquatic system, nutrient enrichment can promote increased primary production. When organic material dies and is decomposed, microbial respiration can increase oxygen demand and contribute to oxygen depletion. Explain that chain before attributing an observed decline in animals to eutrophication; other causes may also need investigating.
About this diagram
Selected soil nitrogen routes, not a complete biogeochemical cycle. Microbes carry out the named transformations; plants do not generally use atmospheric N₂ directly. Feeding, direct ammonium assimilation, deposition and transport are omitted. Intermediates in fixation and denitrification are simplified.
Quadrats, transects and mark–recapture
A population is a group of organisms of one species in a defined area. A community includes populations of different species, and an ecosystem also includes their abiotic environment. Quadrat sampling can estimate the abundance of sessile or sufficiently slow-moving organisms. Randomly chosen positions reduce deliberate selection of favourable patches; sufficient replicated samples help represent spatial variation.
Multiply a mean density by the study area only when the sampled area is appropriately representative. A transect instead samples along a spatial gradient and can relate distributions to changing conditions. Specify whether you measured count, percentage cover or frequency: a species present in many quadrats need not have the largest total biomass.
For suitable mobile animals, mark–release–recapture uses the marked proportion in a later sample to estimate population size. Its simple model assumes a population effectively closed during sampling, retained and detectable marks, mixing of marked animals, and no important change in capture probability caused by marking. Unequal capture probability and loss of marks can bias the estimate. A small recapture count also makes the estimate sensitive to each animal found.
Population growth and succession
Resource availability and conditions can limit growth. Density-dependent effects, such as competition for food or suitable space, can strengthen as population density rises. The carrying capacity is a model of the population the environment can sustain under the specified conditions; those conditions can change. It is not a permanent universal ceiling for the species.
In primary succession, organisms establish on a substrate without an existing developed soil community. Pioneer organisms can alter the environment, for example by contributing organic material and affecting substrate conditions. Later species may then establish, changing competition and community composition. Secondary succession begins where an earlier community was disturbed but important features such as soil remain.
Succession does not guarantee one inevitable endpoint everywhere. Climate, disturbance, species availability and management can alter its course. Grazing or other repeated interventions can maintain a community that would change if those interventions ceased. Use the changes in soil, light or other conditions to explain which species can establish at each stage.
Conservation and management
A conservation decision needs a defined aim, such as retaining a threatened population, restoring habitat connectivity or maintaining a particular community. Management can affect different species differently. Reducing grazing may favour one habitat stage while removing conditions needed by another species. For a management study, choose measurements that test its stated aim: abundance of the target species, for example, or the extent of its habitat.
Compare evidence from repeated surveys using comparable methods. A one-year increase in abundance may reflect weather, detection or movement rather than a durable management effect. Control or comparison sites, longer records and information about the mechanism can strengthen the inference. Preservation emphasises protecting conditions from intervention; conservation can include active management for stated ecological goals.
Worked examples
1. Complete the producer and consumer budget
Annual GPP is 12 000 and producer respiration 4 000 kJ m⁻² yr⁻¹. Consumers ingest 2 000; their faecal/urinary losses total 600 and respiratory losses 1 100 in the same units. Find NPP, net consumer production and transfer efficiency from NPP.
- NPP = 12 000 − 4 000 = 8 000 kJ m⁻² yr⁻¹.
- Net consumer production = 2 000 − (600 + 1 100) = 300 kJ m⁻² yr⁻¹.
- Efficiency from producer NPP = (300 ÷ 8 000) × 100 = 3.75%.
NPP is 8 000, net consumer production 300, and the specified transfer efficiency 3.75%.
Using 2 000 as the denominator would give production as a percentage of intake, a different efficiency. The area, interval and energy unit are matched.
2. Scale a sampled density
Twenty randomly positioned 0.25 m² quadrats contain 60 plants of a target species in total. Estimate the population in a representative 200 m² study area.
- Total sampled area = 20 × 0.25 = 5.0 m².
- Mean density = 60 ÷ 5.0 = 12 plants m⁻².
- Estimated population = 12 × 200 = 2 400 plants.
The estimated population is 2 400 plants.
This is an extrapolation from sampled density. Patchiness and sampling uncertainty remain; the result is not a complete census.
3. Estimate a mobile population
A first sample marks 40 animals. After mixing, a second sample contains 50 animals, of which 10 are marked. Use the simple closed-population model.
- Marked proportion in the second sample = 10/50 = 0.20.
- Treat that proportion as an estimate of 40/N.
- N = (40 × 50) ÷ 10 = 200.
The model estimates a population of 200 animals.
If marks are lost or marked animals avoid the second sampling method, the observed marked proportion can fall and the estimate can be biased upwards.
These are original teaching examples, not reproduced exam questions or an official mark scheme.
Common errors
Energy cycles through the ecosystem like nitrogen.
Energy flows through transfers and dissipates as heat; nitrogen atoms are recycled through transformations.
NPP is the energy all herbivores ingest.
NPP is production after producer respiratory losses; only part need be ingested by selected consumers.
Nitrification converts nitrate into N₂.
Nitrification oxidises ammonium through nitrite to nitrate; denitrification can return nitrate nitrogen to gases.
A calculated population estimate is a census.
It depends on sampled data and model assumptions and has uncertainty.
Check your understanding
Try the questions before opening the answers.
1. Why does consumer intake not equal net consumer production?
Some ingested material is lost without becoming retained production, and respiration transfers part of the assimilated energy. The budget subtracts its stated losses.
2. How could oxygen availability alter nitrogen transformations?
Nitrification is associated with aerobic oxidation, while denitrification is favoured in suitable oxygen-poor conditions. The response also depends on the microbes and substrates present.
3. Why should management surveys retain comparable methods?
Changed quadrat size, placement, season or detection methods can change recorded abundance independently of the ecological effect being tested.
Practice for this topic
- Exponential growth and logarithmic scales
- Ecological sampling calculations
- Energy transfers and productivity
- Statistical tests and conclusions
- Biodiversity index calculations
- Workbench: Field sampling: judge a habitat comparison
- Apply to a case: Ecological sampling: estimates and causation
- Practical guide: Ecology sampling and transect data
Connect this topic to an AQA essay title · Use official papers and mark schemes
Glossary
- Net primary production
- Producer production remaining after producer respiratory losses.
- Ammonification
- Release of ammonium from organic nitrogen.
- Carrying capacity
- Modelled population that an environment can sustain under specified conditions.
References
References used for the explanations and diagrams, checked on 4 October 2026. The diagrams are schematics and are not to scale. Open “About this diagram” for the assumptions and details left out.