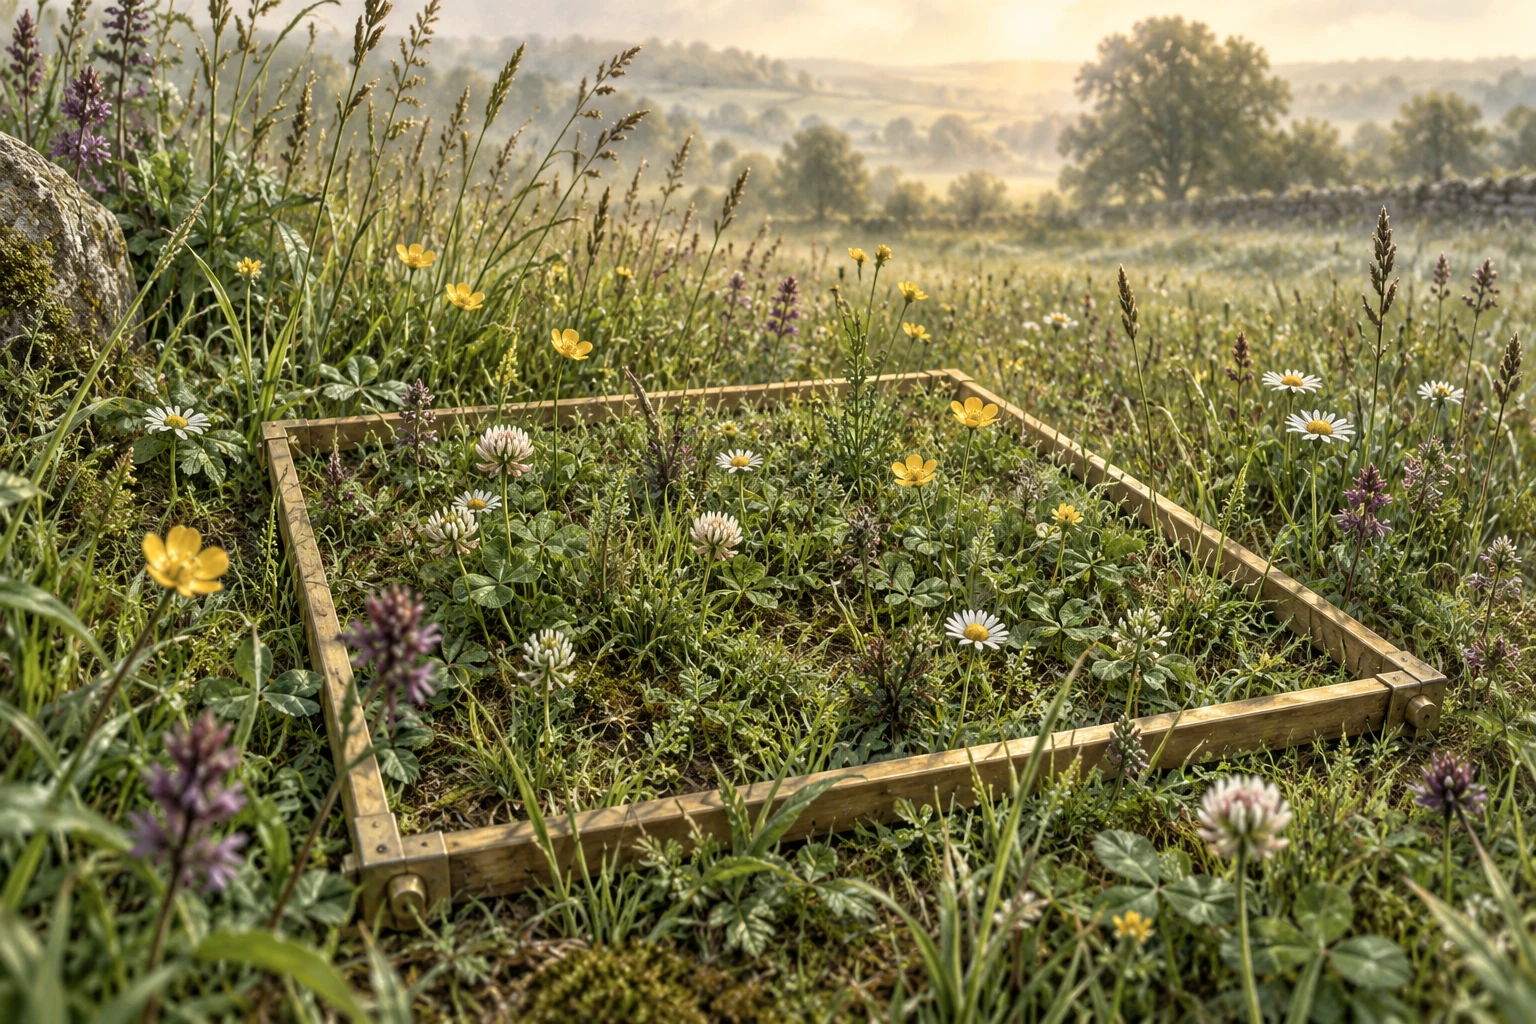
Avoid convenient selection
Random coordinates reduce selection bias when all locations have an appropriate chance of selection. Picking places where the species is easy to see can overestimate abundance. Define how organisms touching quadrat boundaries will be counted and apply that rule consistently.
Use transects for a gradient
A line or belt transect places observations in relation to distance along a defined route. Regularly spaced quadrats can reveal changing abundance. Several independent transects are usually more representative than one route when the habitat is variable.
Keep abundance and frequency separate
Abundance concerns numbers, density or cover. Frequency is the proportion of sampled quadrats containing the species. A species present in every quadrat can still have a low number of individuals per quadrat.
Estimate and compare carefully
Scale mean counts by quadrat area before extrapolating to the habitat. Use comparable sample effort and the same index formula for diversity comparisons. Species richness records how many species were found; evenness concerns their relative abundances.
A pattern is not proof of a cause
An association between abundance and an environmental variable can be consistent with a biological explanation, but other factors may covary. Use the paired measurements and an appropriate test for an association where justified. A field correlation alone does not establish causation.
Worked data example
A species occurs in 12 of 20 sampled quadrats. Mean abundance is 4 plants per 0.25 m² quadrat. Find its frequency and density.
Frequency = 12/20 × 100 = 60%. Density = 4/0.25 = 16 plants m⁻². These describe different aspects of the sample.
Why might random sampling be unsuitable for displaying a continuous pattern along a shore gradient?
A defined transect records position along the gradient directly. Random sampling across the whole habitat answers a different question about the habitat as a whole.