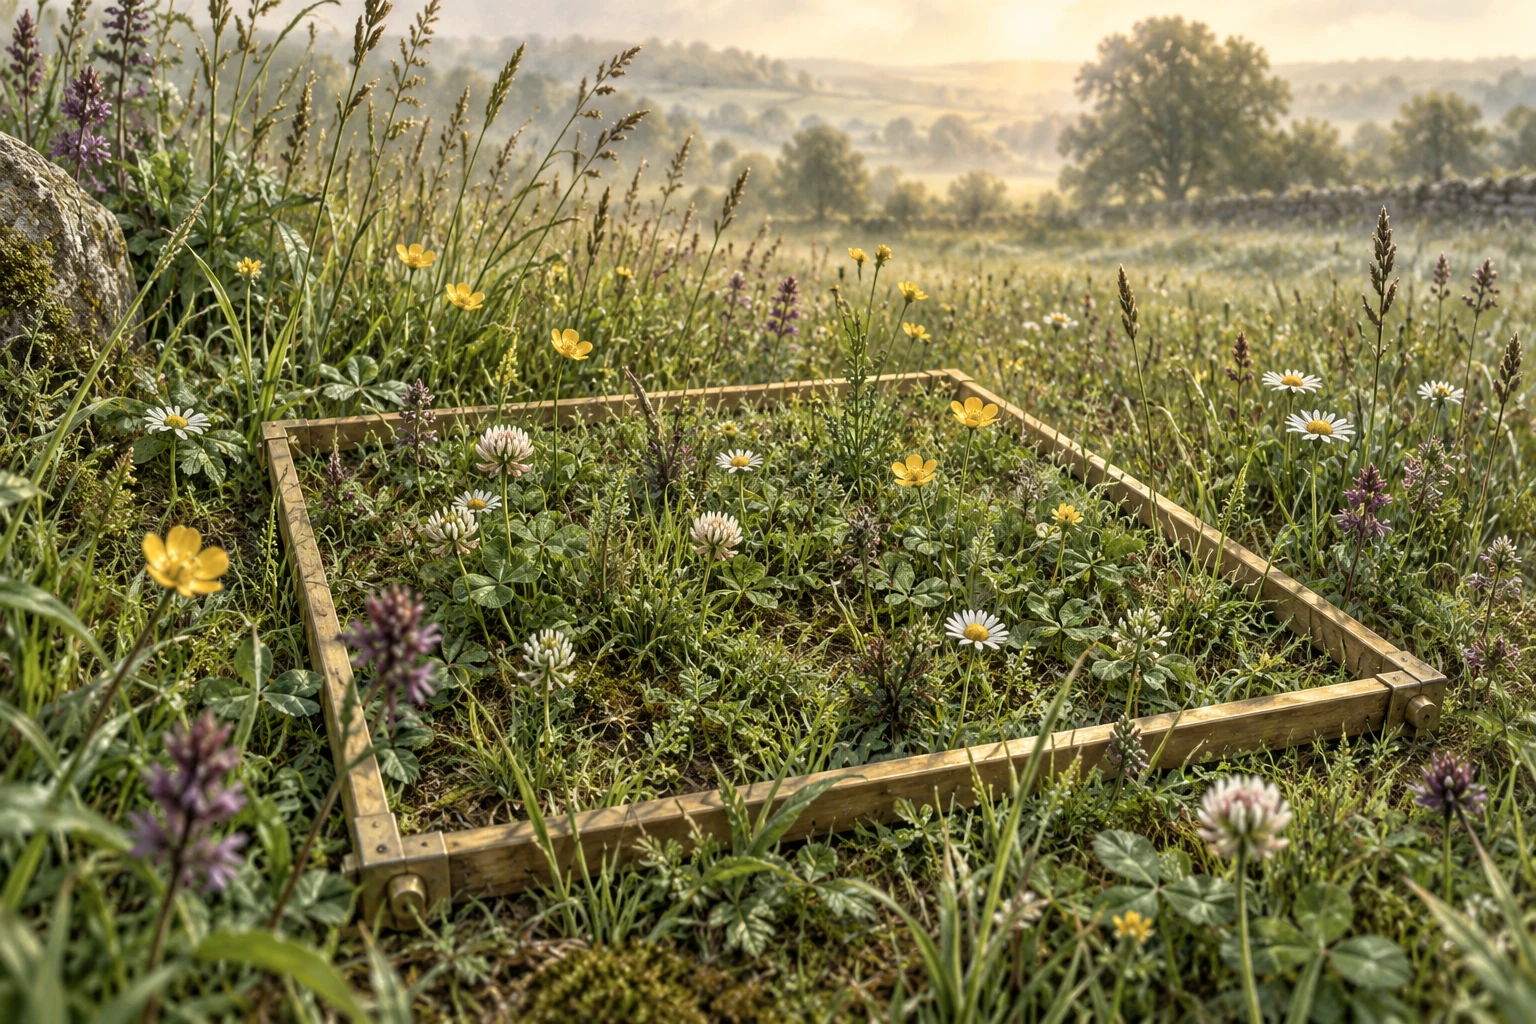
All design choices and example data
Which comparison addresses the question?
- Compare raw plant counts from different-sized quadrats without recording their areas. Raw counts depend on sampled area. Comparable density requires a known area or consistent quadrat size.
- Compare plant counts only at the most densely vegetated positions in each moisture zone. Selecting dense patches biases the estimate of abundance and may distort the moisture association.
- Compare plant counts at randomly selected positions across measured moisture zones. The question concerns a measured environmental gradient and plant density. This is the suitable option for the stated question.
Which set of records allows plant density to be compared with moisture?
- Plant count and moisture at each location, with no quadrat area. Counts depend on sampled area. Record quadrat area, or a fixed known area, to calculate plants per square metre.
- Plant count, quadrat area and moisture at each location. Counts and areas permit density calculation; moisture defines the environmental comparison. This is the suitable option for the stated question.
- Plant presence or absence, quadrat area and moisture at each location. Presence does not distinguish one plant from many. It cannot supply numerical density.
Which sampling approach is useful?
- Use a pre-defined random selection of locations within each zone and consistent quadrat area. Random selection within defined zones reduces deliberate patch selection; consistent area supports comparison. This is the suitable option for the stated question.
- Count the same quadrat three times and treat the counts as three independent locations. Recounting may check observer consistency, but it does not sample spatial variation at new locations.
- Move each randomly chosen quadrat until it contains the target plant. Moving after seeing the vegetation removes the random selection and biases density upwards.
Matched example
Separate locations are selected within each defined zone without targeting dense patches.
Calculation questions and worked method
Calculate density in the 30% moisture zone, in plants m⁻².
Mean = (6 + 7 + 8) ÷ 3 = 7. Density = 7 ÷ 0.5 = 14 plants m⁻².
Estimate the number of plants in its comparable 200 m² zone.
Conditional estimate = 14 × 200 = 2800 plants in the stated comparable zone.
Dense patches are deliberately selected
The example counts are biased upwards by targeting dense patches. More such biased counts do not restore representation.
Calculation questions and worked method
Calculate density in the 30% moisture zone, in plants m⁻².
Mean = (11 + 12 + 13) ÷ 3 = 12. Density = 12 ÷ 0.5 = 24 plants m⁻².
Estimate the number of plants in its comparable 200 m² zone.
Conditional estimate = 24 × 200 = 4800 plants in the stated comparable zone.
Evaluation prompt
Compare the representative-location and dense-patch examples. Explain why more biased quadrats do not solve the sampling problem, limit the inference from the moisture association and state when the 200 m² extrapolation is defensible.
Example explanation and self-check points
Choosing dense patches raises the example counts and systematically over-represents high-density places. More locations selected by the same biased rule can produce a precise but unrepresentative mean. Pre-defined random locations within each zone and consistent areas improve the comparison. The observed moisture association does not isolate a causal effect because other environmental factors may differ. Extrapolation to 200 m² is conditional on those samples representing that comparable zone, not every part of the habitat.
- I identify deliberate dense-patch selection and distinguish bias from random variation.
- I propose representative selection and avoid treating association as proof of causation.
- I limit extrapolation to the stated comparable zone rather than the whole habitat.
Print matched-example questions · Print questions with answers
Original fixed datasets and reasoning tasks. Full requirements: AQA practical assessment · OCR A specification. These activities do not replace laboratory work or assessment of practical competence.