What you’ll learn
- Track chromosomes and chromatids through replication and meiosis.
- Construct a genetic cross from parental genotypes and stated inheritance.
- Use population frequencies without confusing alleles with genotypes.
Connections: AQA 3.2.2, 3.4.3, 3.7.1, 3.7.2 · OCR A 2.1.6, 6.1.2. Selected meiosis, monohybrid inheritance and population-frequency mechanisms, with a mitosis comparison. Detailed cell-cycle control, dihybrid and sex-linked crosses, linkage, epistasis, chi-squared testing and the full evolution content need further study.
In this chapter
Chromosomes and chromatids
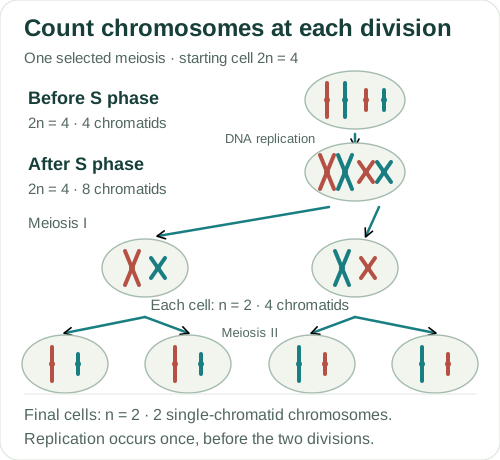
A chromosome is counted by its centromere before sister chromatids separate. DNA replication in S phase produces two sister chromatids joined at that region. The quantity of DNA doubles, but the chromosome number and ploidy do not. A diploid cell with 12 chromosomes therefore has 12 chromosomes and 24 chromatids after replication. Drawing every replicated chromosome as an X can help with the count, but real chromosomes are not always visible in that condensed form.
Homologous chromosomes have the same sequence of gene loci, although they may carry different alleles. One homologue in a pair came from each parent. Sister chromatids are replicated copies of one chromosome; crossing over can later change the relationship between their sequences. A gene is a DNA sequence with a functional product, and an allele is a version of a gene. Neither is a whole chromosome.
Mitosis normally maintains chromosome number: replicated chromosomes line up individually and sister chromatids separate, producing daughter nuclei with the same chromosome complement, provided the chromosomes separate normally. Meiosis has two nuclear divisions after one round of replication. Its reduction division is what prepares a haploid chromosome complement for sexual reproduction.
About this diagram
Chromosome bookkeeping, not a complete stage sequence. Spindles, nuclear envelopes and crossing over are omitted. Colours distinguish parental homologues; this no-crossover example has repeated products. The four-cell layout is a selected symmetric division model, not mammalian oogenesis.
The two meiotic divisions
During prophase I, homologous chromosomes pair. Crossing over exchanges corresponding DNA segments between non-sister chromatids of a homologous pair. In metaphase I, each pair has an orientation on the spindle that is independent of the orientations of other pairs in the simple model. These events produce different combinations of alleles in the products of meiosis.
In anaphase I, homologous chromosomes move apart while sister chromatids remain together. Each resulting nucleus has one member of each homologous pair and is haploid, even though its chromosomes still have two chromatids. There is no second S phase between the divisions. In meiosis II, sister chromatids separate. Random fertilisation adds another source of variation by combining gametes from two parents.
Crossing over is left out of this diagram to make the chromosome counts easier to follow. Some final products therefore repeat. Four products of meiosis need not have four different genotypes. The four similarly sized cells also do not represent mammalian egg formation, where cytoplasm is divided unequally.
Monohybrid crosses
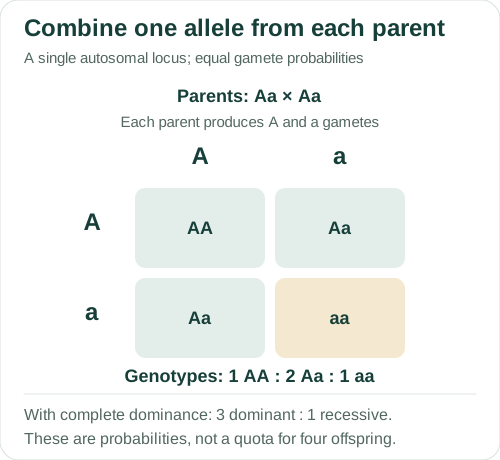
At a single autosomal locus, an individual with genotype Aa is heterozygous. In the usual segregation model, its gametes carry A or a, each with probability 0.5. The gamete does not carry Aa at that locus. Put the possible gametes of one parent across the top of a grid and those of the other parent down the side, then combine one allele from each at every intersection.
The Aa × Aa figure gives AA, Aa, Aa and aa as four equally likely combinations. With complete dominance of A, AA and Aa share the dominant phenotype, giving a 3:1 phenotype ratio. The genotype ratio remains 1:2:1. Dominance describes expression in the heterozygote; it does not establish which allele is common, beneficial or more likely to be passed on.
An expected ratio is a probability model. Four offspring do not have to include exactly one recessive individual. When a problem concerns several offspring, state whether their outcomes are being treated as independent. A test cross with a homozygous recessive parent can help distinguish a dominant homozygote from a heterozygote, but a small sample may not reveal every possible outcome.
About this diagram
One autosomal locus with two alleles, complete dominance and equal gamete contributions. The model excludes selection, linkage, sex linkage and other inheritance patterns.
Codominance and other inheritance patterns
Under codominance, both alleles contribute detectably to the heterozygote’s phenotype. Use notation that makes the alleles clear, such as Cᴿ and Cᵂ, and describe the actual phenotype given in the question. Do not automatically relabel the heterozygote as a blend. Under incomplete dominance, the heterozygote has a phenotype intermediate between those of the two homozygotes.
For a sex-linked example, write the allele on the relevant sex chromosome and track the chromosome supplied by each parent. For two loci, first establish whether the question permits independent assortment. Genes close together on the same chromosome can be linked, so a familiar 9:3:3:1 expectation cannot be assumed without the required conditions. Write the parental genotypes and work out their possible gametes before filling in the offspring combinations.
Allele frequencies and Hardy–Weinberg
For a locus with two alleles, p + q = 1 represents their frequencies in the population’s allele pool. A homozygote contributes two copies of one allele; a heterozygote contributes one of each. Counting individuals with the dominant phenotype cannot by itself establish p because those individuals can have two different genotypes.
Under Hardy–Weinberg conditions, genotype frequencies are p², 2pq and q². The model assumes random mating, a very large population, and no selection, mutation or migration affecting the allele frequencies. If the recessive phenotype uniquely identifies aa under complete dominance, its frequency estimates q²; take the square root to estimate q. The model then supplies an expected heterozygote frequency, not a direct count of heterozygotes.
A difference between observed and expected counts requires evaluation of sample size and the proposed model. A suitable chi-squared test can assess how compatible the counts are with the expectation, subject to its assumptions. A non-significant result does not prove that the model is true, and a significant result does not identify which biological mechanism caused the difference.
Worked examples
1. Track a 2n = 12 cell
A diploid cell has 12 chromosomes before replication. Give the chromosome and chromatid counts per cell after S phase, after meiosis I and after meiosis II.
- After S phase, each of 12 chromosomes has two chromatids: 24 chromatids.
- After meiosis I, each cell has six chromosomes, each still with two chromatids: 12 chromatids.
- After meiosis II, each final cell has six single-chromatid chromosomes.
Counts per cell are 12/24 after S phase, 6/12 after meiosis I and 6/6 after meiosis II (chromosomes/chromatids).
Each count refers to one cell. After meiosis I, a cell has one chromosome from each homologous pair, so it is haploid even though each chromosome still has two chromatids.
2. Use a cross for more than one offspring
In Aa × Aa, A is completely dominant. Under an independent-offspring model, find the probability that all three offspring have the dominant phenotype.
- For one offspring, P(dominant phenotype) = 3/4.
- For three independent outcomes, multiply (3/4) × (3/4) × (3/4).
- 27/64 = 0.421875.
The probability is 27/64, approximately 0.422 or 42.2%.
The event includes every genotype sequence in which each offspring is AA or Aa. Adding three copies of 3/4 would not give a valid joint probability.
3. Estimate the heterozygote frequency
In a large population, 16% show a recessive phenotype uniquely associated with aa. Assume Hardy–Weinberg equilibrium for this two-allele locus.
- q² = 0.16, so q = 0.40.
- p = 1 − 0.40 = 0.60.
- 2pq = 2 × 0.60 × 0.40 = 0.48.
The expected heterozygote frequency is 0.48, or 48%.
The recessive phenotype supplied q², not q. The calculation depends on the stated inheritance and equilibrium assumptions.
These are original teaching examples, not reproduced exam questions or an official mark scheme.
Common errors
Replication makes a diploid cell tetraploid.
It doubles DNA quantity and chromatid number without adding another homologous chromosome set.
Meiosis I separates sister chromatids.
Homologues separate in meiosis I; sister chromatids separate in meiosis II.
Dominant means the most common allele.
Dominance concerns the heterozygote’s phenotype, not population frequency.
A 3:1 ratio guarantees three of each four offspring.
It gives expected probabilities; actual small samples can differ.
Check your understanding
Try the questions before opening the answers.
1. Why is a cell haploid after meiosis I even though its chromosomes are replicated?
Its nucleus has one homologue from each pair, hence one chromosome set. Each chromosome retaining two chromatids does not make two homologous sets.
2. What would distinguish the genotype and phenotype ratios in a codominant Aa × Aa example?
The genotype ratio remains 1 AA:2 Aa:1 aa under equal segregation. If all three genotypes have distinguishable phenotypes, the phenotype ratio is also 1:2:1 rather than the complete-dominance 3:1.
3. Why cannot a dominant-phenotype count alone give the frequency of A?
The count combines AA and Aa individuals, which contribute different numbers of A alleles. Additional genotype information or explicit population-model assumptions are needed.
Practice for this topic
- Inheritance probabilities and genetic ratios
- Hardy–Weinberg calculations
- Chi-squared calculations
- Apply to a case: Inheritance: expected counts and chi-squared
Connect this topic to an AQA essay title · Use official papers and mark schemes
Glossary
- Homologous chromosomes
- A chromosome pair with corresponding gene loci; alleles can differ.
- Haploid
- Having one complete set of chromosomes.
- Allele frequency
- Proportion of allele copies at a locus that are a particular allele.
References
References used for the explanations and diagrams, checked on 4 October 2026. The diagrams are schematics and are not to scale. Open “About this diagram” for the assumptions and details left out.